Temp range: 10.3–30.9 °Cmu range: 0.037–0.138 per daySource: El Moustaid et al. 2021 Supplement | Data: Lysyk & Danyk 2007, Mayo et al. 2020
This analysis recreates key thermal performance curves from the Bluetongue virus transmission study, fitting Bayesian models to estimate Maximum A Posteriori (MAP) parameters for each trait. The solid lines show posterior means/medians with 95% HPD intervals (dashed lines).
Temp range: 10.3–30.9 °Cmu range: 0.037–0.138 per dayCreating NIMBLE model:
- Configuring model. - Compiling model.
Creating MCMC:
- Configuring MCMC.
- Compiling MCMC.
- Running MCMC.
Progress:
|-------------|-------------|-------------|-------------|
|-------------------------------------------------------|
|-------------|-------------|-------------|-------------|
|-------------------------------------------------------|
|-------------|-------------|-------------|-------------|
|-------------------------------------------------------|
|-------------|-------------|-------------|-------------|
|-------------------------------------------------------|
Configuring Output:
- Finding Max. a Post. parameters.
**MAP Estimates (μ):**• T_min = 6.03 °C
• T_max = 39.97 °C
• q = 3e-04
• sigma.sq = 4e-04 Creating NIMBLE model:
- Configuring model. - Compiling model.
Creating MCMC:
- Configuring MCMC.
- Compiling MCMC.
- Running MCMC.
Progress:
|-------------|-------------|-------------|-------------|
|-------------------------------------------------------|
|-------------|-------------|-------------|-------------|
|-------------------------------------------------------|
|-------------|-------------|-------------|-------------|
|-------------------------------------------------------|
|-------------|-------------|-------------|-------------|
|-------------------------------------------------------|
Configuring Output:
- Finding Max. a Post. parameters.
**MAP Estimates (EFD):**• T_min = 12.9 °C• T_max = 36 °C• q = 0.023 • sigma.sq = 55.7955 Creating NIMBLE model:
- Configuring model. - Compiling model.
Creating MCMC:
- Configuring MCMC.
- Compiling MCMC.
- Running MCMC.
Progress:
|-------------|-------------|-------------|-------------|
|-------------------------------------------------------|
|-------------|-------------|-------------|-------------|
|-------------------------------------------------------|
|-------------|-------------|-------------|-------------|
|-------------------------------------------------------|
|-------------|-------------|-------------|-------------|
|-------------------------------------------------------|
Configuring Output:
- Finding Max. a Post. parameters.
**MAP Estimates (pL):**• T_min = 18.01 °C• T_max = 37.24 °C• q = 2e-04 • sigma.sq = 0.00302 Creating NIMBLE model:
- Configuring model. - Compiling model.
Creating MCMC:
- Configuring MCMC.
- Compiling MCMC.
- Running MCMC.
Progress:
|-------------|-------------|-------------|-------------|
|-------------------------------------------------------|
|-------------|-------------|-------------|-------------|
|-------------------------------------------------------|
|-------------|-------------|-------------|-------------|
|-------------------------------------------------------|
|-------------|-------------|-------------|-------------|
|-------------------------------------------------------|
Configuring Output:
- Finding Max. a Post. parameters.
**MAP Estimates (a):**• T_min = 11.4 °C• T_max = 36 °C• q = 4e-04 • sigma.sq = 0.008 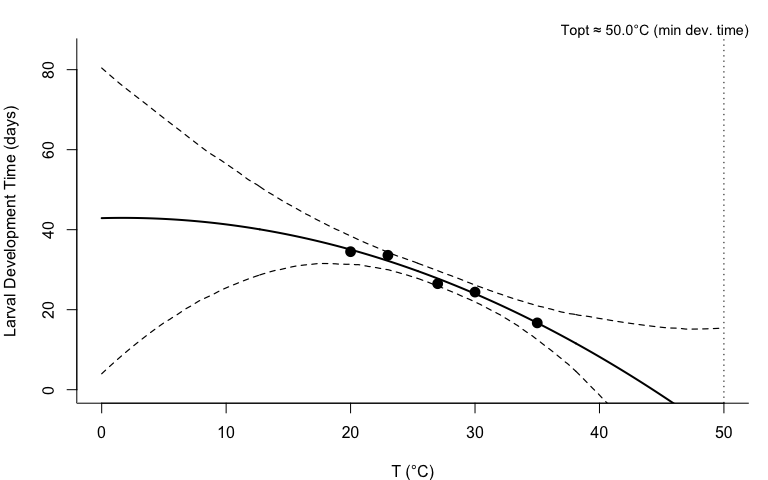
**Fitted Quadratic Model (LDT):**• Intercept = 27.78 • Linear coefficient = -1.2032 • Quadratic coefficient = -0.023137 • Residual SD = 1.42 • R-squared = 0.981
**Model:** LDT = 27.78 + -1.2032 *(T - 27 ) + -0.023137 *(T - 27 )²
**Note:** Development time decreases with temperature (faster development at higher T).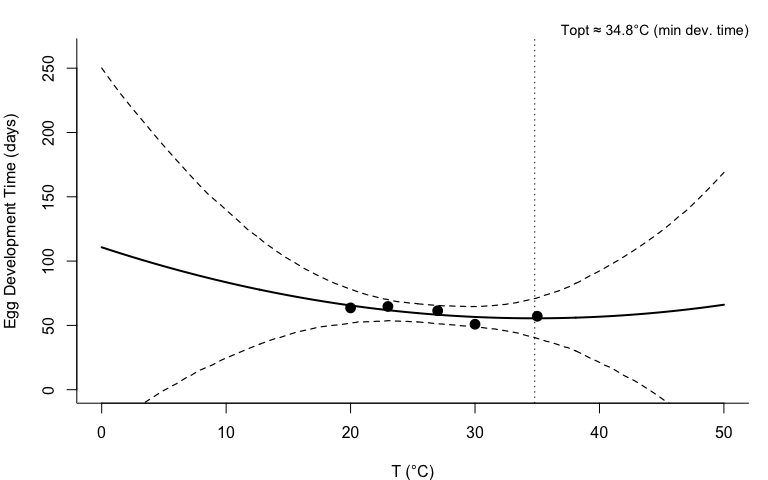
**Fitted Quadratic Model (EDT):**• Intercept = 58.23 • Linear coefficient = -0.7303 • Quadratic coefficient = 0.047594 • Residual SD = 5.29 • R-squared = 0.56
**Model:** EDT = 58.23 + -0.7303 *(T - 27 ) + 0.047594 *(T - 27 )²
**Note:** Egg development time varies with temperature following quadratic relationship.
**Fitted Quadratic Model (PuDT):**• Intercept = 48.26 • Linear coefficient = -3.6431 • Quadratic coefficient = 0.307141 • Residual SD = 2.48 • R-squared = 0.993
**Model:** PuDT = 48.26 + -3.6431 *(T - 27 ) + 0.307141 *(T - 27 )²
**Note:** Pupal development time decreases with temperature (faster development at higher T).